Fine-Tuning Qwen3-32B on 16 H200s with Slurm on Kubernetes
Field notes from a function-calling PoC on Nebius Soperator: what worked, what bit me, and where it fits
I wanted to know how Soperator behaves under a real fine-tuning job, not a hello-world. So I set up a field-style PoC: take Nebius Soperator from an empty project to a fine-tuned model, with monitoring and a before-and-after inference test, and treat the whole thing as if I had to do a customer-facing handoff afterward. These are the field notes.
The workload was function calling. The goal was a model that emits a valid tool call, in the right schema, that a parser can actually consume. That last part turns out to be the whole game, and I will come back to it.
What Soperator is, and why I cared
Soperator is Slurm running on managed Kubernetes. On paper that sounds like two schedulers wearing a trenchcoat, but the split is sensible. Kubernetes handles the parts it is good at: node lifecycle, restarts, the supporting services. Slurm sits on top and gives the ML side the interface it already knows, sinfo and srun and sbatch. The people running training never have to touch the Kubernetes layer. For a team that thinks in Slurm and does not want to operate a cluster, that division is the appeal.
The environment
Two GPU worker nodes, eight NVIDIA H200 each, sixteen total, on an InfiniBand fabric, with a 1 TB shared filesystem mounted identically on every node.
The shared filesystem is the quiet hero. Because the same path resolves on the login node and on every worker, the model weights, the dataset, the virtual environments, and the checkpoints all live in one place every job can see. That removes a whole class of "works on this node, not that one" problems before they start.
After terraform apply, the acceptance test was boring in the best way. SSH to the login node, sinfo shows two idle workers, and one srun across both nodes returns sixteen GPU UUIDs through the scheduler. Platform half done.
The run
Base model was Qwen3-32B, chosen for strong tool-use out of the box and an Apache-2.0 license. Dataset was Salesforce's xLAM function-calling set, sixty thousand examples of query, available tools, and the correct call. Method was LoRA, so the base weights stay frozen and only a small adapter trains, 134M parameters against 32B.
The one decision worth explaining is distribution. The reflex for a 32B model across 16 GPUs is FSDP, which shards weights and gathers them as needed. But sharding earns its keep when you are training the weights. These are frozen. Sharding frozen weights means paying network cost every step to reassemble parameters that never change. So I used plain DDP instead. Every GPU holds a full copy of the model, which fits comfortably (about 64 GB in bf16 against 141 GB of H200 memory), and the only thing crossing InfiniBand each step is the adapter gradients, a few megabytes. The GPUs almost never wait on the network. That is the reason utilization stayed where it did.
Three epochs took about 78 minutes. GPU utilization held between 94 and 100 percent, plateauing near 96. Final held-out token accuracy was 98.2 percent. The artifact was a 537 MB adapter.
Monitoring
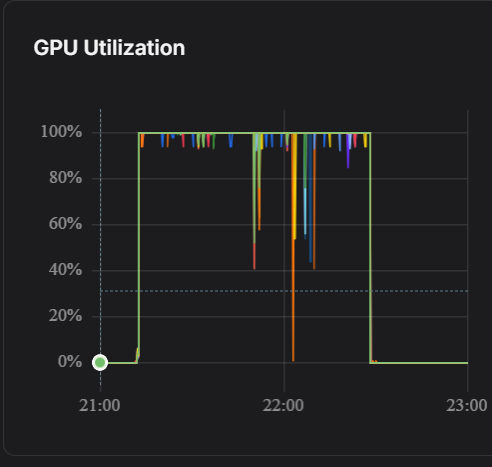 GPU utilization across the 16 H200s during the run
The cluster came with observability already wired: DCGM exporters on the GPU nodes, Grafana dashboards populated, and the Nebius console graphing utilization and power per node. I did not install a monitoring component, which, coming from the observability world, is the part I double-checked.
The number I trust most is not utilization, it is power. Per-GPU draw sat near 670 W against a 700 W cap for the length of the run. Utilization percentages can look busy while doing very little. Sustained power is harder to fake.
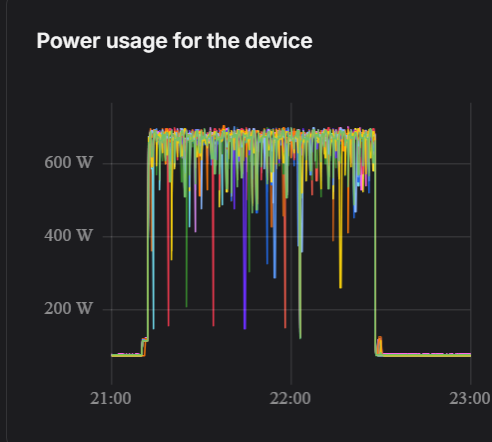 Per-GPU power draw, near 670 W against a 700 W cap The telemetry also shows the shape of the run cleanly: vertical walls at job start and finish, and two small dips at the epoch boundaries where training pauses to evaluate and checkpoint.
The inference test, and the actual lesson
Token accuracy is a training-health signal, not something to deploy on. The real question is whether the output parses. So I served both models with vLLM, as Slurm jobs rather than separate Kubernetes deployments, and sent the same twenty tool-use prompts to each. The only thing I scored was whether the response is a valid function call in the expected schema.
Base model: 3 of 20. Fine-tuned: 16 of 20.
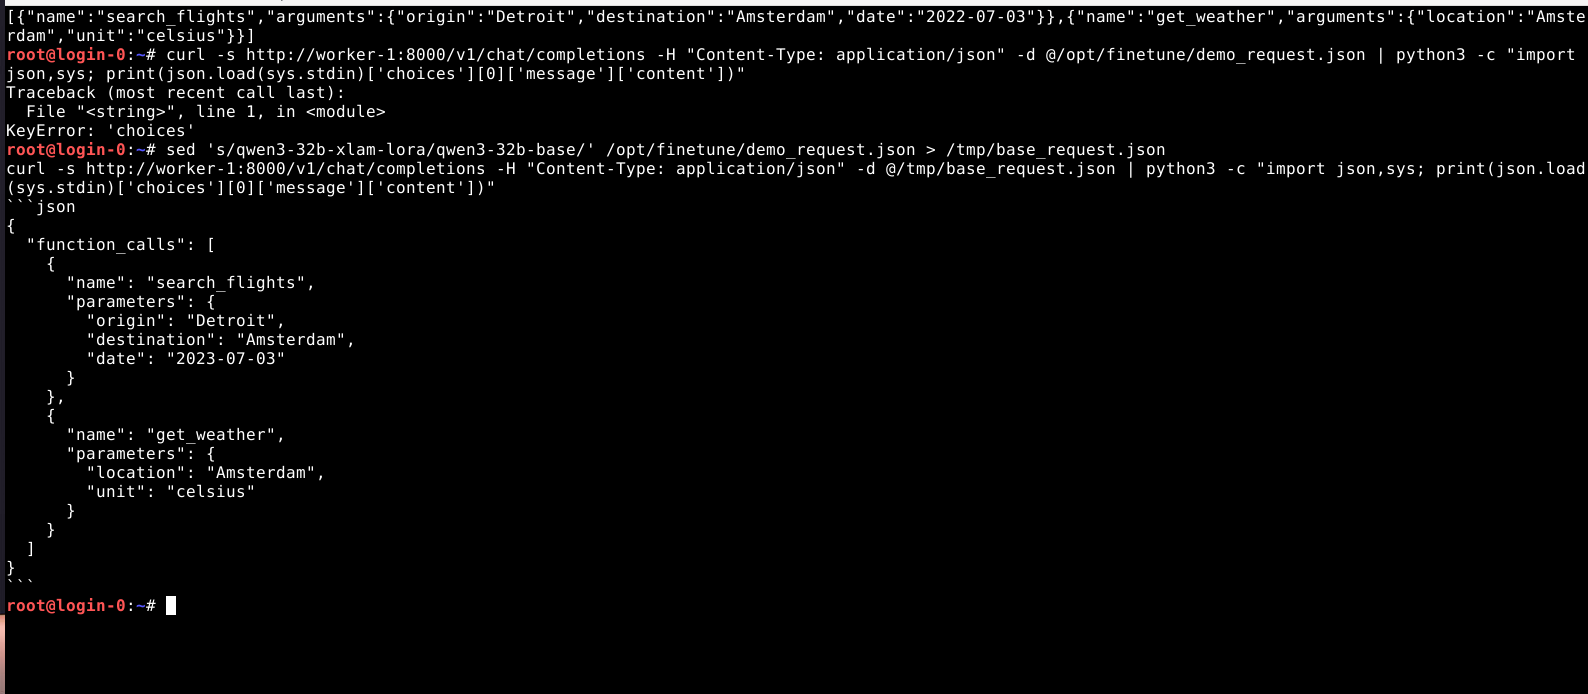 The base model's answer: right content, wrong schema, wrapped in a markdown fence
The failure pattern on the base side is the instructive part. The content was often roughly right. It would wrap the JSON in markdown fences, or invent its own field names, function and parameters instead of name and arguments. For a human reader that is fine. For an agent that has to parse the call, it is a hard failure. The fine-tune did not make the model smarter. It made the output survive the parser. In agent workflows that is the difference between a demo and something you can build on.
What bit me
A few things, all operational, none exotic. The sandbox had a disk quota that the default node-local data layout blew straight through, so I moved scratch onto the shared filesystem. Windows-edited files arrived with CRLF line endings that broke shell scripts on the cluster. A transformers version mismatch needed pinning before the chat template behaved. And a cold Triton cache made the first step look hung when it was just compiling.
The pattern across all of them: the cluster was fine, the friction was in my own setup, and every fix belonged in the runbook so the next person does not lose the same hour.
Where Soperator fits, and what I would do next
If your team lives in Slurm and wants someone else operating the Kubernetes underneath, this fits well. The handoff was clean enough that a team could re-run it from the runbook without me.
Where I would be more careful: the storage design needs real thought past a PoC. I used in-cluster NFS for home directories, which is fine for a pilot and not for scale, and the quota math should be done up front rather than discovered mid-run.
Next, I would mix non-tool-call examples into the training data. The fine-tune got slightly worse at plain conversation while getting much better at its job, which is a normal tradeoff. The production answer is either route those turns to the base model or train against them. I would also fold the comparison harness into the same job graph, so re-scoring a new model is one command instead of a sequence.
That is the PoC. One config file became a working sixteen-GPU cluster, the cluster spent 78 minutes producing a 537 MB adapter, and that adapter turned three parseable tool calls out of twenty into sixteen. The rest is in the runbook.
The full runbook, Terraform, training scripts, and evidence index are on GitHub.